How to graph COSINE functions
A cosine function is the same as a sine function, only the cosine function is shifted to the left by π/2. If you've figured out how to graph sine functions, graphing cosine functions aren't that different.
y=cos x
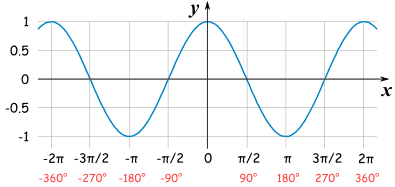
Even though the cosine graph is just the sine graph shifted left by π/2, it is easier to think of the initial point of y=cos x as (0,1).
All the necessary parts of graphing a cosine function are the same as they are in the sine function.
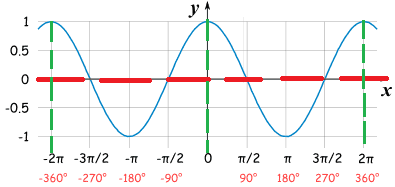
The midline is the imaginary line on the y-axis directly in the middle of the maximum and minimum points of the graph. Traced by the dotted red line in the graph below.

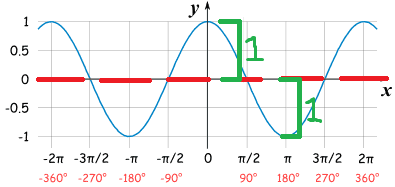
The amplitude is the distance the max or min is from the midline. From the funtion y=cos x you can see that the coefficient in front of cos is not there, but technically it is 1.
The period is how far on the x-axis the function goes before it repeats itself. You can find the period of a graph by taking the coefficient in front of x and dividing 2π by that coefficient. Each period is separated by a dotted green line.
The initial point of a cosine graph will change with any amplitude change, vertical shift, or horizontal shift. To find the initial point with an amplitude change, you multiply the amplitude by 1, since 1 is the y-coordinate of initial point of the parent function. If there is a vertical shift and amplitude change, you multiply 1 by the amplitude before adding the vertical shift. Also remember that for a cosine function, the initial point is NOT on the midline.
Just like the function of sine, cosine too has a pattern. Starting at the initial point of a positive cosine function, which will be at the max, the graph will pass the midline, curve at the min, pass the midline again, and return to the max for the end of one period. For a negative cosine function, the initial point will be at the min. From there it will pass the midline, curve at the max, pass the midline again, and return the the min for the end of one period.
